Data, specifically Big Data, is used each and every day by many businesses to help transform and improve all kinds of experiences. This data is collected in many ways – for instance, through interviews, surveys, browsing behaviour, and more. With these large amounts of data being constantly collected, the ability to utilise data analytics and become a data analyst has now become more important than ever.
First, What Is Data Analytics?
Data analytics requires one to organise and sort through raw data using different tools and systems. These tools and systems play a huge role in ensuring that data analysts are able to gain key insights from large data sets. These insights found can then go on to impact large decisions for companies. Looking to take on the role of a data analyst? Here’s how you can get started.
Learn How To Use Excel
Excel is a must-have for analysing data. Not only does it have many tools and functions that will allow you to clean and prep data for analysis, but it also allows you to visualise your data with charts and graphs – providing you with even more avenues to analyse your data. Furthermore, Excel skills are used frequently in many different industries and are highly valuable, so not only will it help with your start in data analytics, but it’ll help with your career as a whole.
Learn How To Use Tableau
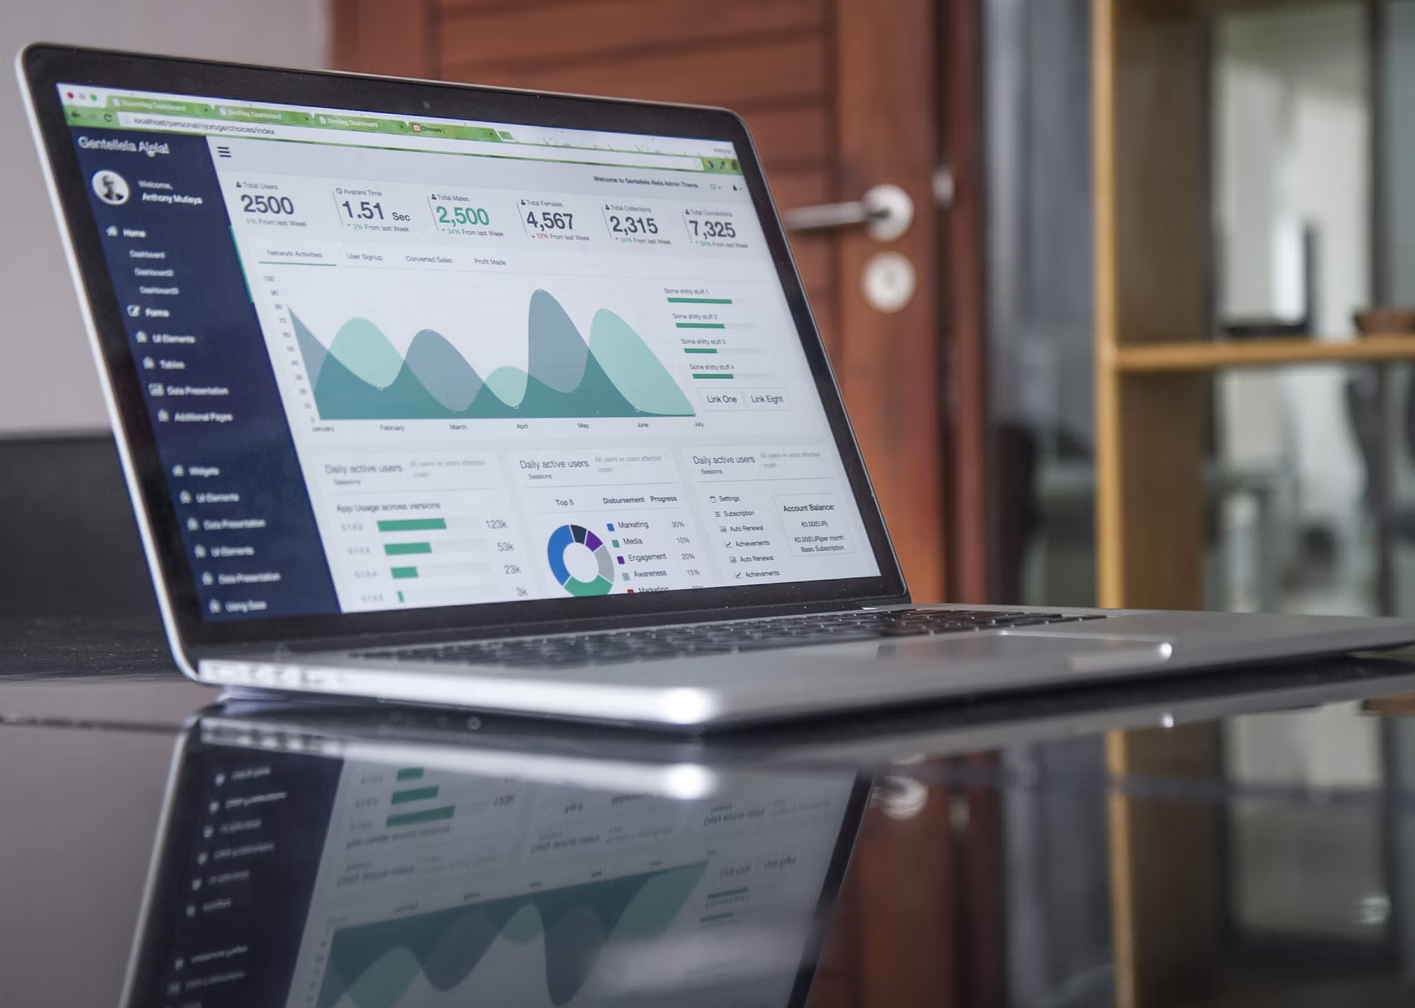
Data visualisation plays an important role in getting your start as a data analyst, and a good way to start with it is through Tableau. Tableau is a data visualisation tool that helps to report and explore large volumes of data. Like Excel, you’ll be able to clean and prep your data on Tableau. However, Tableau has the upperhand when it comes to ease of creating interactive visualisations – allowing you to analyse your data through a simple drag and drop.
Learn How To Use SQL
‘SQL’ stands for Structured Query Language, which is a language curated to manage databases. As a data analyst, knowing how to use this language will definitely help when creating, operating and retrieving data. Moreover, this language is similar to that of an Excel sheet – consisting of rows and column to organise and structures data – making it relatively easy to pickup once you’ve learned how to use the former. For mor information on SQL and how it works, check out our blog post: ‘A Beginner’s Guide To SQL’.
Along with acquiring the knowledge to use Excel, Tableau and SQL, consider taking up a professional data analytics as well, in order to gain an accredited certification. Through our Data Analytics Course, you’ll be able to learn all the aforementioned tools listed, along with receiving feedback from industry professionals and gaining connections.
About Vertical Institute
Vertical Institute prepares individuals for the jobs of tomorrow. We specialise in teaching in-demand skills, building the next generation of changemakers and inventors through our world-class tech courses and certifications.
Singaporeans and PRs can receive up to 70% IBF Funding off their course fees with Vertical Institute. The remaining fees can be claimable with SkillsFuture Credits or UTAP Funding.