
This is the 3rd article of a 3-part series. At the end of the 3-part series, we would have answered 3 potential questions a junior data analyst might have.
In the previous article, we explored how a data analyst in Singapore could utilize three platforms for showcasing one’s acquired skills. Another potential question a junior data analyst might have would be – What is the nature of data analytics work done? In this article, we look at how the analytics maturity of an organization dictate the type of data analytics work being done.
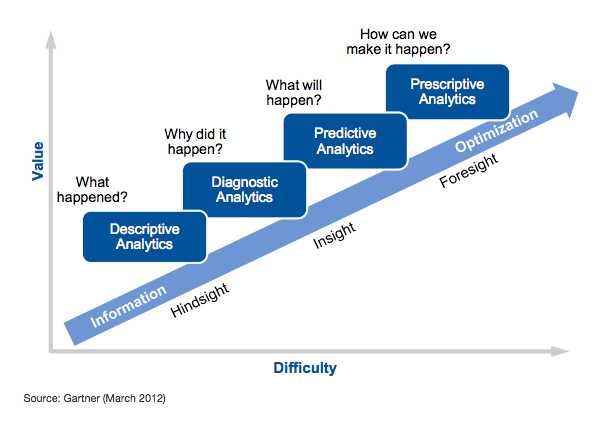
One way to measure an organization’s analytics maturity level would be the use of Gartner’s Analytics Maturity Model 2012. For any organization, it can be either one of the four stages: Descriptive, Diagnostic, Predictive or Prescriptive.
Descriptive Analytics
The initial data analytics stage is the Descriptive Analytics stage. At this stage, there is a strong focus on historical data and trends. A data analyst in such a company is expected to be well-versed in Excel and PowerPoint. Majority of the time would be spent on manually consolidating data from different sources and preparing the data within Excel sheets. Other employees are often not data-trained and would find data analysis a foreign concept. The data analyst in this company is the subject matter expert for data analytics course.
The tools used by the data analyst would often be open-sourced or pre-packaged with Microsoft Office Suite such as Excel and PowerPoint. The data is commonly displayed in Excel sheets in rows and columns while visualisations are generated using basic in-built PowerPoint charts. Ultimately, the visualisations would stop at showing what has happened in the business.
Diagnostic Analytics
The next stage is Diagnostic Analytics. At this stage, there is a greater focus on explaining the “why”. A data analyst in Singapore would need to work closely with multiple business users to uncover department-specific insights. A data analyst’s work becomes inter-departmental. More time is needed to be spent on understanding the business to uncover reasons.
The tools used by the data analyst would still include Microsoft Office Suite such as Excel and PowerPoint. However, the need to extract insights from multiple departments efficiently would require the knowledge of Structured Query Language (SQL) and databases. The visualisations shift from understanding “what has happened” to “why it has happened”.
Predictive Analytics
The third stage is Predictive Analytics. At this stage, the business stakeholders are more looking to pre-emptively forecast what would happen. By combining the insights from Descriptive and Diagnostic stages, a data analyst is required to have the skills and knowledge to predict what happens in the future.
The tools used by the data analyst would shift towards predictive software for large data. An example would be Tableau which is a data visualisation software meant for large data analysis. Tableau also allows for on-the-fly forecasting through its in-built forecast algorithms. Visualisations would move beyond static charts and become much more interactive such as the use of filters.
Prescriptive Analytics
The final stage is Prescriptive Analytics. At this stage, the business is looking to identify how to make desirable outcomes happen. Depending on the organization, the data analyst could be required to work together with department heads and data scientists. The data analyst’s role would be to facilitate discussions between the business users and technical data scientists in forming new business strategies.
The tools used would shift beyond predictive software for large data analysis to customized software built by data scientists. On top of Excel, SQL and Tableau, a data analyst would require exposure to coding languages like Python and R for meaningful communication with data scientists.
Conclusion
Gartner’s Analytics Maturity Model showcases the different stages of an organization’s analytics maturity. When looking for work opportunities in data analytics, knowing an organization’s analytics maturity is important in helping one assess the expectation of the role. Ultimately, it boils down to aligning personal career aspirations with the company’s analytics needs for a meaningful career.
Top data analytics courses in Singapore
If you are interested in joining Excel, SQL and Tableau courses in Singapore, get started now! Sign up here for our Data Analytics Bootcamp, which covers all three topics! Our data science course is taught directly by expert data analysts in Singapore.
About Vertical Institute
Vertical Institute prepares individuals for the jobs of tomorrow. We specialise in teaching in-demand skills, building the next generation of changemakers and inventors through our world-class tech courses and certifications.
Singaporeans and PRs can receive up to 70% IBF Funding off their course fees with Vertical Institute. The remaining fees can be claimable with NTUC UTAP Funding or SkillsFuture Credits.


